
Football is a team sport that is played with the help of all the players on the team. How would we know that a player is actively helping the team? Heatmaps and Attribute Overviews answer the question. It gives us more than just goals. It shows us where players are on the field, what they are doing, what they do, how they play.
What is a Heatmap?
A heatmap is an image of where a player spends a lot of time during a game. The color on the map designates which parts of the field the player uses the most. Vivid and brighter colors mark high activity zones, whereas paler tones show where the player was rarely present. For instance, a forward would have bright colors close to the opponent’s goal since they will spend most of their time near the opponent’s goal.
An example of that is Mohamed Salah. Playing as a forward, you’ll see from his heatmap that he spends a lot of the minutes in the attacking half and near the goal of the opponent. His attacking attribute rating is 90, which seems logical with 21 goals out of 23 matches this season for Liverpool in the Premier League.
How Heatmaps Help Us Understand a Player’s Role
For instance, heatmaps can help us determine if the player is doing the things that they should be doing. The heatmap of a midfielder may cover more of the field revealing that it is helping to attack and defend.
For example, Pedri is Barcelona’s central midfielder. His heatmap illustrates that while he orchestrates attacks and ventures into the attacking half, he also tracks back into the defensive part of the field and provides key passes to unlock defenses. This is very easily seen on his Sofascore profile.
These tools allow us to look past only goals. They help us to know where the players are on the field, what they are doing, and how well they are playing.

What are Stat and Attribute Overviews?
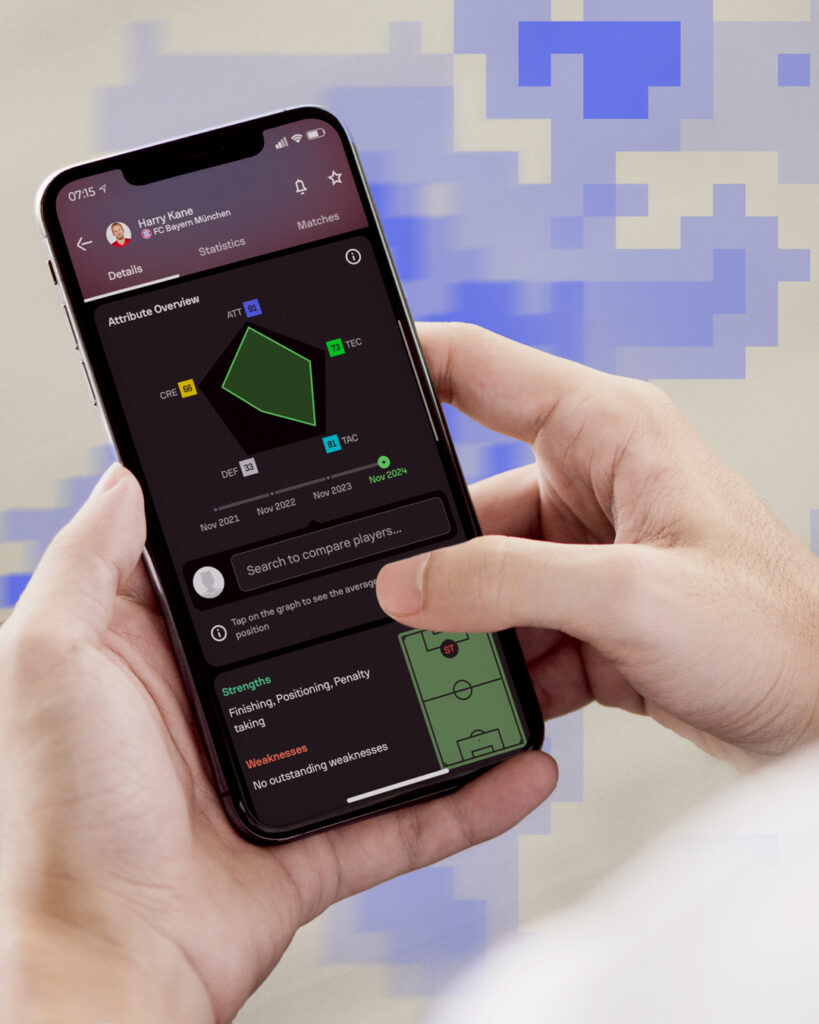
Stat overview tells you what a player has done in a specific game or season and Attribute Overview indicates their overall potential and strengths in different areas. While stats are concrete numbers recorded during a game, attributes are subjective evaluations of a player’s natural skills.
Stat overviews give us concrete numbers about how a player performs in a game. Stat overviews give data like goals scored, assists, tackles made, and passes completed. Attribute overview indicates the player’s overall potential and strengths in different areas such as attacking, defending, creativity, technical and tactical ability, often represented through a number system. These numbers help us understand a player’s strengths and weaknesses.
For example, Lionel Messi is one of the best players in the world. He plays as a forward for Inter Miami. His attributes show that he has an 85 rating for the attack. This means he is great at scoring goals and creating chances. He also has 84 for technique, showing how skilled he is with the ball. His stats reflect the same, with 21 goals and 11 assists in 22 games for Inter Miami in the 2024 MLS season.
Overviews also show us weaknesses. Messi’s defensive rating is 30, which means he does not spend much time helping his team defend. This is normal for a forward, as their job is to attack. On the other hand, a player like Virgil van Dijk has a high defensive rating, meaning he is excellent at stopping the opposition from scoring.
Specific player reviews help understand Heatmaps and Stats. Let’s start with Kylian Mbappé. In his heatmap, he showed that he spends most of his time near the opponent’s goal. Stats indicate he is good with long shots and finishes, with 15 goals and more than 2 shots on target per game in the current season. His attack rating of 82 reflects his sharp positioning, intelligent runs, and clinical finishing, making him a constant goal threat.

Lastly, we look at Luka Modrić, a star for Real Madrid. His heatmap shows he works hard in the middle of the field. Modrić’s attributes show that he is good at creativity, and creating chances for others. His pass success rate is high, which is important for a playmaker. Attributes and stats are not just numbers. It helps us to see how good a player is in each aspect of the game. As an example, Erling Haaland’s stats indicate he executes long-shot chances well and is top notch in finishing and hence he scores a lot.
Using Stats to Improve
Football players can use their stats to improve. Coaches can look at stats and heatmaps to see where players need to get better. If a player has a lot of chances to score but misses, coaches can work with them to improve their finishing. If a player is not spending enough time defending, the coach might ask them to work harder on the defensive side.
For example, Mbappé’s heatmap shows heavy activity on the left flank and near the opponent’s goal, highlighting his attacking presence. Coaches might encourage him to take up more central positions at times to increase his involvement in creating chances for teammates.

Heatmaps, Attributes and Stats Help Fans Understand the Game
Heatmaps, attributes and stats are also used by fans to understand what is taking place during a given game. These tools allow you to see how a player is being utilized for the team. Sometimes a player might perform well but still lack the aim to score a goal. For example, if a defender who is preventing a lot of attacks does not receive the same amount of attention as the player who scored the winning goal, their stats indicate that the team was successful because of him. Fans when they look at a player’s heatmap, attributes and stats get a better idea about what the player has done in the game.
Conclusion
Heatmaps, attributes and stats are great tools that will help us to know the players better. They tell us how to play, how players move and do, how they play. Using these tools, coaches can improve their players, and fans can enjoy the game even more. Understanding how a player contributes to the team is just as important as watching them score goals. With heatmaps and stats, we can see the game in a whole new way.